- Docs
- Run a node
- Monitoring validators
Monitoring validators
There is a Grafana dashboard that is compatible with all the cosmos-sdk and tendermint based blockchains.
Preview
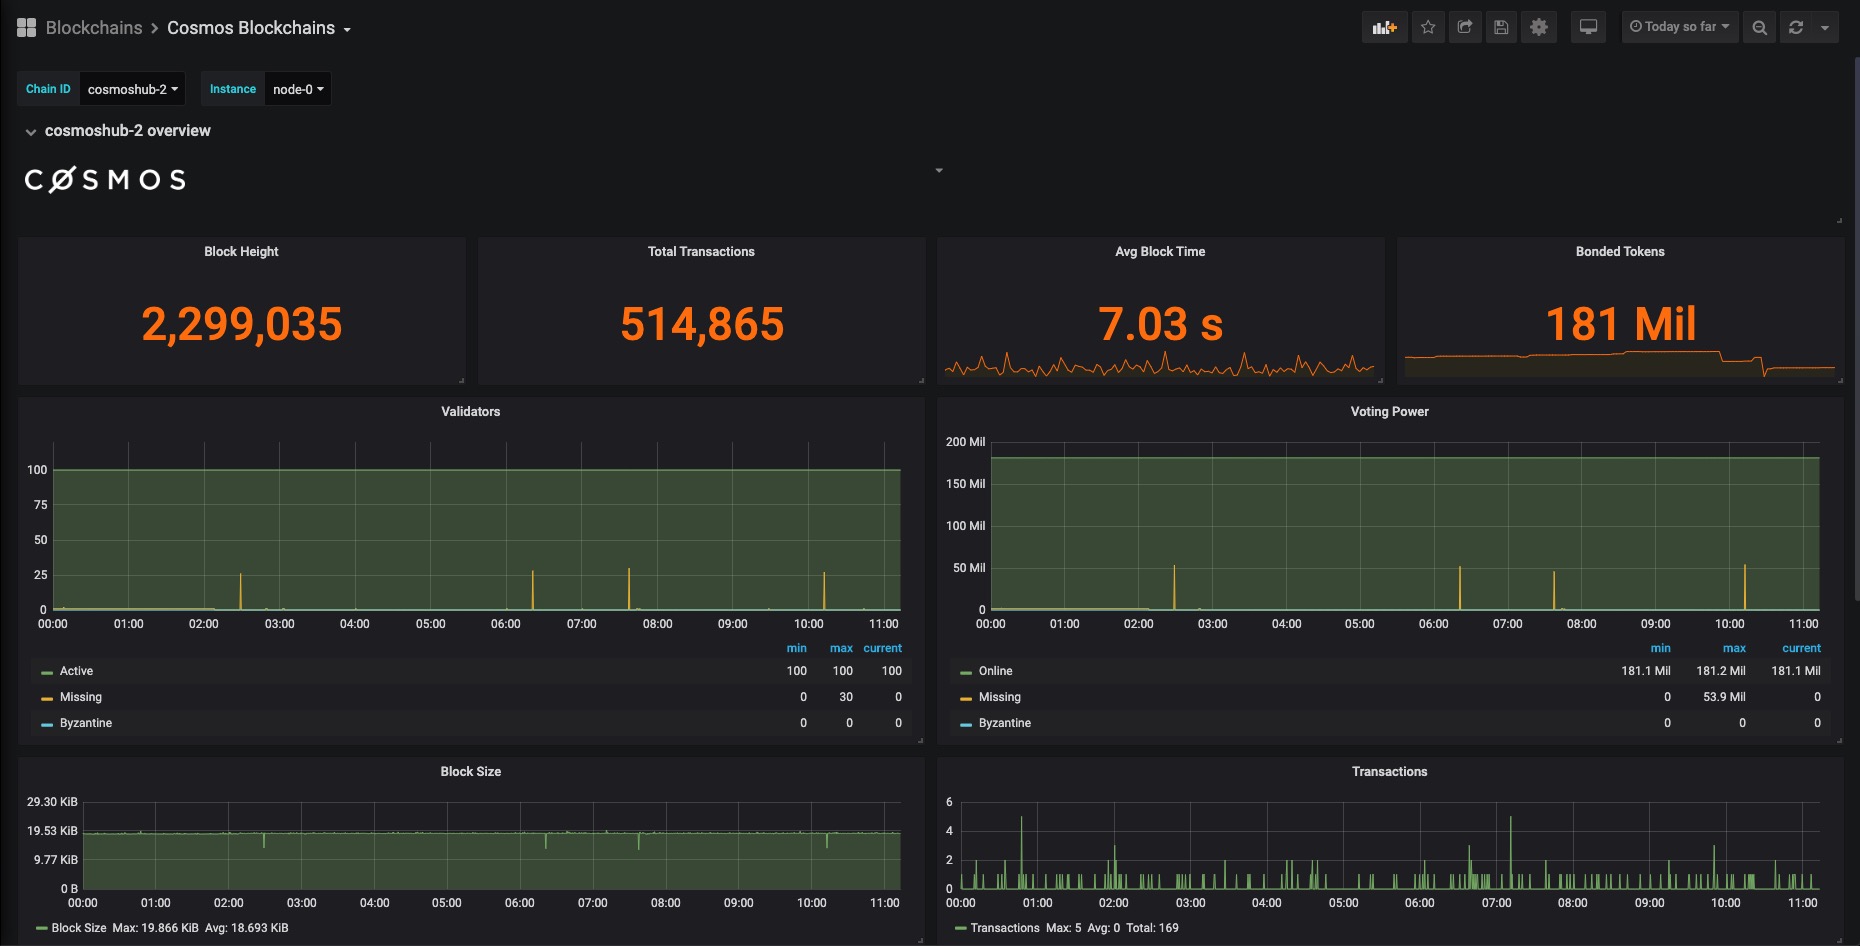
Let's set it up for our network.
Prerequisites
First install Grafana and Prometheus on your machine.
Enable tendermint metrics
You will need to edit the node's config/config.toml file, setting prometheus to true:
sed -i 's/prometheus = false/prometheus = true/g' <YOUR-NODE-HOMEDIR>/config/config.tomlIn order for the change to take effect you will need to restart the node. You should be able to access the tendermint metrics which defaults to port 26660: http://localhost:26660
Configure prometheus targets
Find prometheus.yml file and append the following job under the scrape_configs:
- job_name: archway static_configs: - targets: ['localhost:26660'] labels: instance: validatorInfo
On linux machines this file can be found under this path: /etc/prometheus/prometheus.yml
Resolving port conflicts
When both archwayd and prometheus are running on the same machine, one of the service will encounter a port conflict, causing it to be unable to execute. Do the following to resolve this issue.
Open the node's config/app.toml file and look for:
[grpc]address = "0.0.0.0:9090"Change the port to something else:
[grpc]address = "0.0.0.0:9095"Restart prometheus and archwayd
Restart archwayd using the followng:
sudo archwayd stopsudo archwayd startThe you can restart prometheus:
sudo service prometheus restartAdding a prometheus service file (Optional)
A service file can be used to allow for the automatic restart of the service, helping to make sure that your node is always monitored.
You can create a service file with:
nano /etc/systemd/system/prometheus_s.serviceAdd the following content to the file:
[Unit]
Description=Prometheus
Wants=network-online.target
After=network-online.target
[Service]
User=$USER
Type=simple
ExecStart=/home/$USER/prometheus/prometheus \
--config.file /home/$USER/prometheus/prometheus.yml \
--storage.tsdb.path /home/$USER/prometheus/ \
--web.console.templates=/home/$USER/prometheus/consoles \
--web.console.libraries=/home/$USER/prometheus/console_libraries
Restart=always
RestartSec=3
LimitNOFILE=4096
[Install]
WantedBy=multi-user.target
You can then reload the systemctl daemon:
sudo systemctl daemon-reloadThen enable the service:
sudo -S systemctl enable prometheusStart prometheus as a service:
sudo systemctl start prometheusYou can then check that the service is properly running with:
sudo systemctl status prometheusYou can now check the status of the prometheus service by running:
systemctl status prometheus.serviceIf you see some output like the following, it means the service is running without an issue:
● prometheus.service - Monitoring system and time series database
     Loaded: loaded (/lib/systemd/system/prometheus.service; enabled; vendor preset: enabled)
     Active: active (running) since Wed 2021-10-06 15:32:48 CEST; 17min ago
       Docs: https://prometheus.io/docs/introduction/overview/
   Main PID: 457917 (prometheus)
      Tasks: 21 (limit: 37746)
     Memory: 48.3M
     CGroup: /system.slice/prometheus.service
             └─457917 /usr/bin/prometheus
Configure grafana
If you have grafana installed on your node, you can access it via navigating to this address: http://localhost:3000
The default username and password is admin.
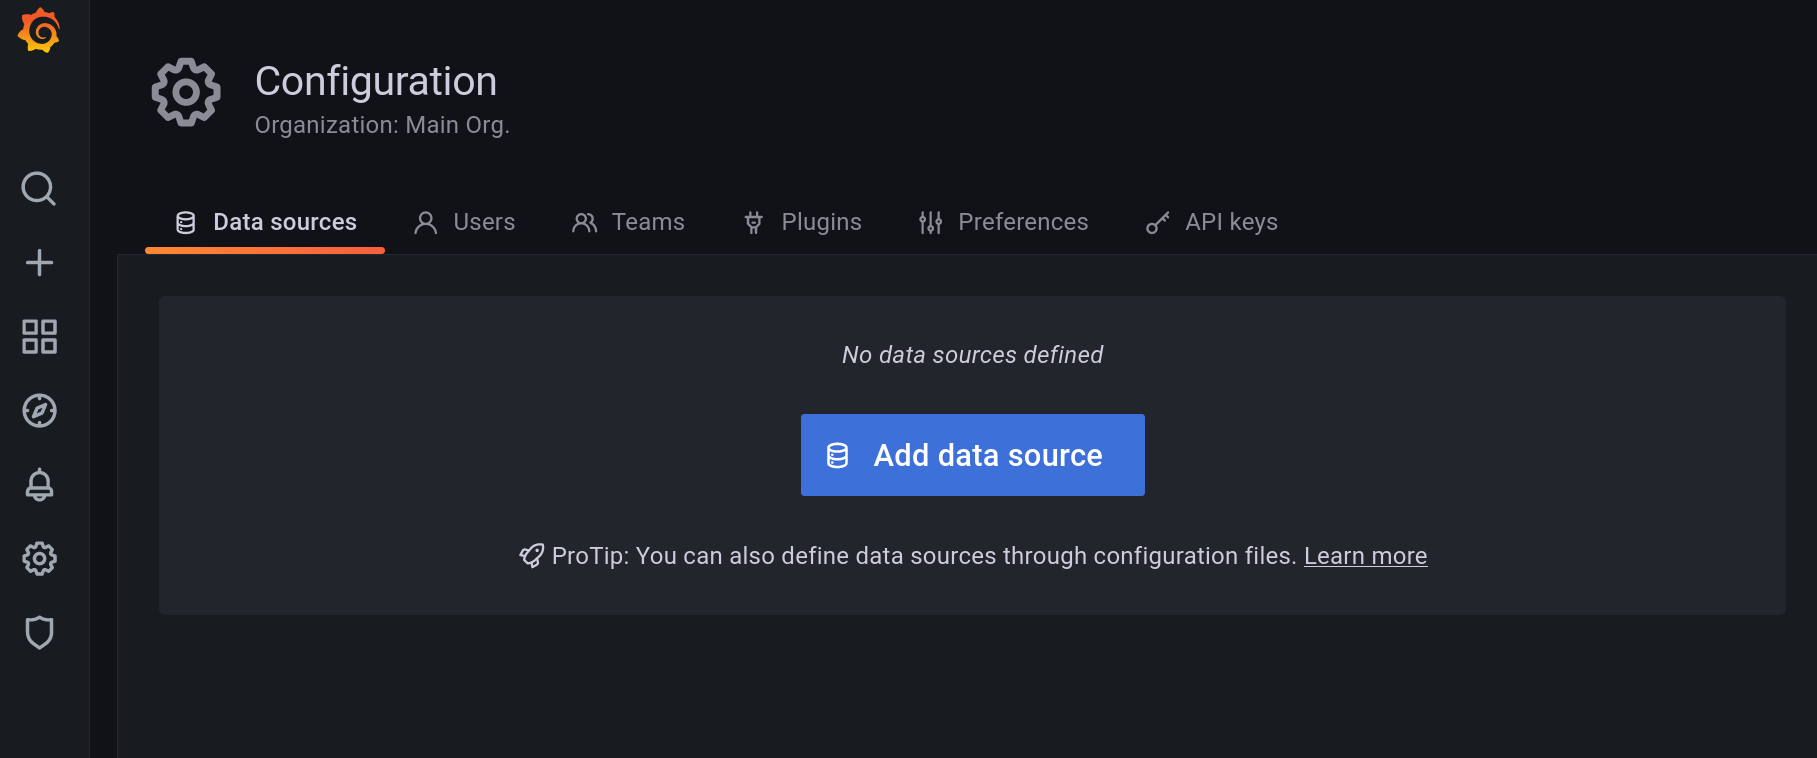
Click on config, then add a data source.
Select Prometheus from the list and add its URL.
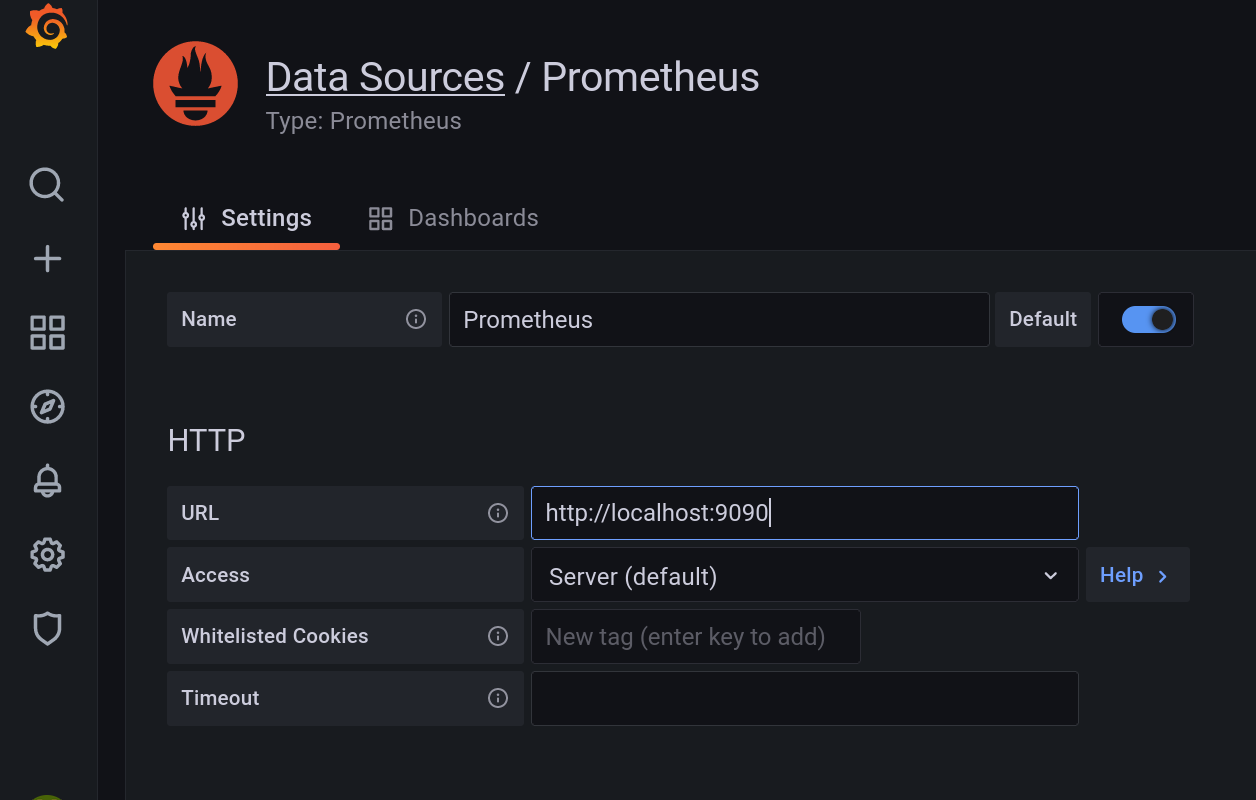
If you have installed it on your node, the default URL is: http://localhost:9090
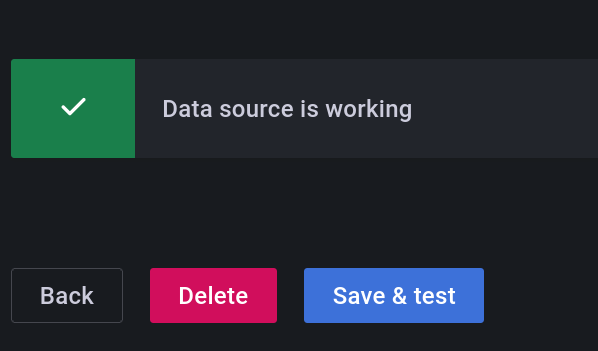
Click on Save & test to make sure everything is alright.
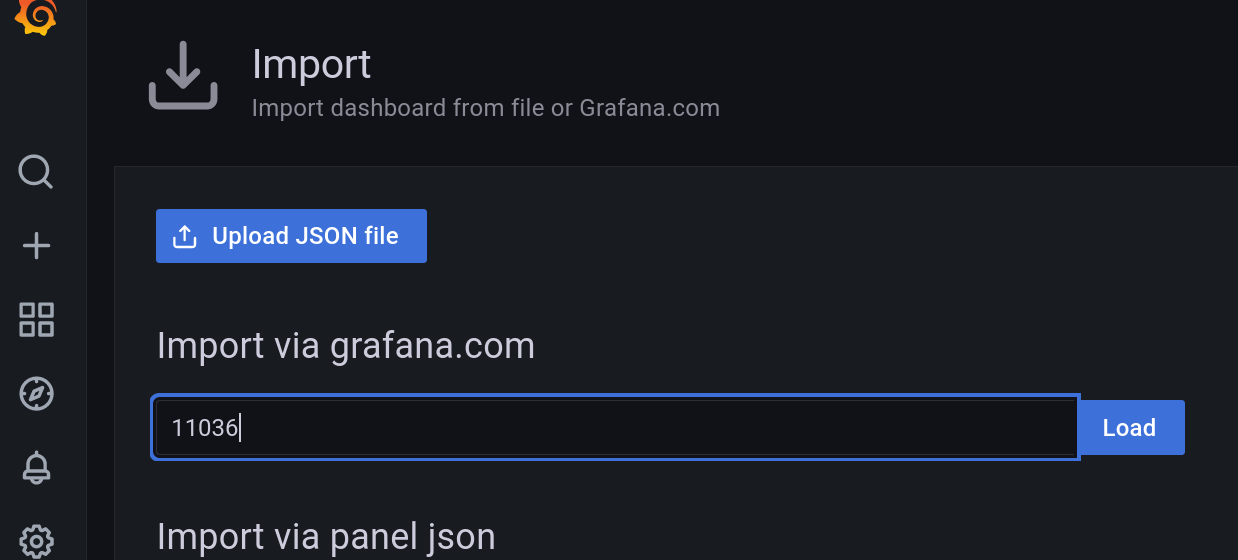
Import grafana dashboard
Copy and paste the Grafana Dashboard ID11036 and click on Load to complete importing.
Now you should be able to monitor your validator node.